Heikin-Ashi (Koma-Ashi) with Moving Average Type for Amibroker (AFL)
brevco over 16 years ago Amibroker (AFL)
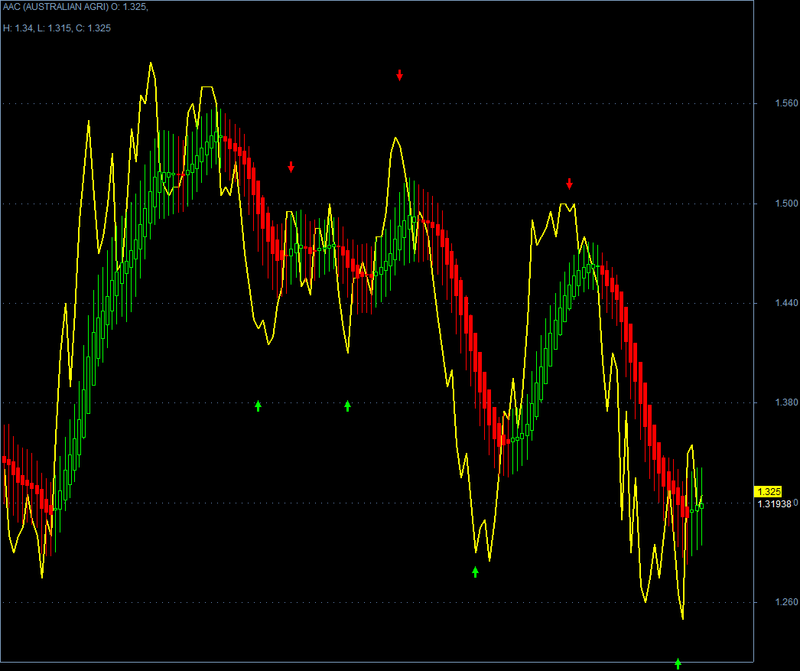
This version of Heikin-Ashi is adjustable in the parameter window and plots pivots.
Screenshots
Indicator / Formula
Copy & Paste Friendly
/*
Heikin-Ashi(Koma-Ashi) with Moving Average Type
 */
SetChartOptions(2, chartWrapTitle);
// Calculate Moving Average
MAPeriod = Param("MA Period", 15, 1, 100);
MAOpen = EMA(Open, MAPeriod);
MAHigh = EMA(High, MAPeriod);
MALow = EMA(Low, MAPeriod);
MAClose = EMA(Close, MAPeriod);
HaClose = (MAOpen + MAHigh + MALow + MAClose) / 4;
HaOpen = AMA(Ref(HaClose,  - 1), 0.5);
// for graph collapse
for (i = 0; i <= MAPeriod; i++)
  HaClose[i] = Null;
/*
// same
// HaOpen = (Ref(HaOpen, -1) + Ref(HaClose, -1)) / 2;
HaOpen[ 0 ] = HaClose[ 0 ];
for(i = 1; i < BarCount; i++) {
HaOpen[i] = (HaOpen[i - 1] + HaClose[i - 1]) / 2;
}
 */
HaHigh = Max(MAHigh, Max(HaClose, HaOpen));
HaLow = Min(MALow, Min(HaClose, HaOpen));
// outs comments
"BarIndex = " + BarIndex();
"Open = " + Open;
"High = " + High;
"Low = " + Low;
"Close = " + Close;
"HaOpen = " + HaOpen;
"HaHigh = " + HaHigh;
"HaLow = " + HaLow;
"HaClose = " + HaClose;
// Plot graphs
_N(Title = StrFormat("{{NAME}} - {{INTERVAL}} {{DATE}} HaOpen %g, HaHigh %g, HaLow %g, HaClose %g (%.1f%%) {{VALUES}}", HaOpen, HaHigh, HaLow, HaClose, SelectedValue(ROC(HaClose, 1))));
PlotOHLC(HaOpen, HaHigh, HaLow, HaClose, _DEFAULT_NAME(), ParamColor("Color", colorBlack), styleCandle);
/* **********************************
Code to automatically identify pivots
 ********************************** */
// -- what will be our lookback range for the hh and ll?
farback = Param("How Far back to go", 100, 50, 5000, 10);
nBars = Param("Number of bars", 12, 5, 40);
// -- Title.
Title = Name() + " (" + StrLeft(FullName(), 15) + ") O: " + Open + ", H: " + High + ", L: " + Low + ", C: " + Close;
// -- Plot basic candle chart
PlotOHLC(Open, High, Low, Close, "BIdx = " + BarIndex() + "\n" + "O = " + O + "\n" + "H = " + H + "\n" + "L = " + L + "\n" + "C ", colorYellow, styleLine | styleThick);
GraphXSpace = 7;
// -- Create 0-initialized arrays the size of barcount
aHPivs = H - H;
aLPivs = L - L;
// -- More for future use, not necessary for basic plotting
aHPivHighs = H - H;
aLPivLows = L - L;
aHPivIdxs = H - H;
aLPivIdxs = L - L;
nHPivs = 0;
nLPivs = 0;
lastHPIdx = 0;
lastLPIdx = 0;
lastHPH = 0;
lastLPL = 0;
curPivBarIdx = 0;
// -- looking back from the current bar, how many bars
// back were the hhv and llv values of the previous
// n bars, etc.?
aHHVBars = HHVBars(H, nBars);
aLLVBars = LLVBars(L, nBars);
aHHV = HHV(H, nBars);
aLLV = LLV(L, nBars);
// -- Would like to set this up so pivots are calculated back from
// last visible bar to make it easy to "go back" and see the pivots
// this code would find. However, the first instance of
// _Trace output will show a value of 0
aVisBars = Status("barvisible");
nLastVisBar = LastValue(Highest(IIf(aVisBars, BarIndex(), 0)));
_TRACE("Last visible bar: " + nLastVisBar);
// -- Initialize value of curTrend
curBar = (BarCount - 1);
curTrend = "";
if (aLLVBars[curBar] <
aHHVBars[curBar])
{
  curTrend = "D";
}
else
{
  curTrend = "U";
}
// -- Loop through bars. Search for
// entirely array-based approach
// in future version
for (i = 0; i < farback; i++)
{
  curBar = (BarCount - 1) - i;
  // -- Have we identified a pivot? If trend is down...
  if (aLLVBars[curBar] < aHHVBars[curBar])
  {
    // ... and had been up, this is a trend change
    if (curTrend == "U")
    {
      curTrend = "D";
      // -- Capture pivot information
      curPivBarIdx = curBar - aLLVBars[curBar];
      aLPivs[curPivBarIdx] = 1;
      aLPivLows[nLPivs] = L[curPivBarIdx];
      aLPivIdxs[nLPivs] = curPivBarIdx;
      nLPivs++;
    }
    // -- or current trend is up
  }
  else
  {
    if (curTrend == "D")
    {
      curTrend = "U";
      curPivBarIdx = curBar - aHHVBars[curBar];
      aHPivs[curPivBarIdx] = 1;
      aHPivHighs[nHPivs] = H[curPivBarIdx];
      aHPivIdxs[nHPivs] = curPivBarIdx;
      nHPivs++;
    }
    // -- If curTrend is up...else...
  }
  // -- loop through bars
}
// -- Basic attempt to add a pivot this logic may have missed
// -- OK, now I want to look at last two pivots. If the most
// recent low pivot is after the last high, I could
// still have a high pivot that I didn't catch
// -- Start at last bar
curBar = (BarCount - 1);
candIdx = 0;
candPrc = 0;
lastLPIdx = aLPivIdxs[0];
lastLPL = aLPivLows[0];
lastHPIdx = aHPivIdxs[0];
lastHPH = aHPivHighs[0];
if (lastLPIdx > lastHPIdx)
{
  // -- Bar and price info for candidate pivot
  candIdx = curBar - aHHVBars[curBar];
  candPrc = aHHV[curBar];
  if (
  lastHPH < candPrc AND
  candIdx > lastLPIdx AND
  candIdx < curBar)
  {
    // -- OK, we'll add this as a pivot...
    aHPivs[candIdx] = 1;
    // ...and then rearrange elements in the
    // pivot information arrays
    for (j = 0; j < nHPivs; j++)
    {
      aHPivHighs[nHPivs - j] = aHPivHighs[nHPivs -
      (j + 1)];
      aHPivIdxs[nHPivs - j] = aHPivIdxs[nHPivs - (j + 1)];
    }
    aHPivHighs[0] = candPrc;
    aHPivIdxs[0] = candIdx;
    nHPivs++;
  }
}

else
{
  // -- Bar and price info for candidate pivot
  candIdx = curBar - aLLVBars[curBar];
  candPrc = aLLV[curBar];
  if (
  lastLPL > candPrc AND
  candIdx > lastHPIdx AND
  candIdx < curBar)
  {
    // -- OK, we'll add this as a pivot...
    aLPivs[candIdx] = 1;
    // ...and then rearrange elements in the
    // pivot information arrays
    for (j = 0; j < nLPivs; j++)
    {
      aLPivLows[nLPivs - j] = aLPivLows[nLPivs - (j + 1)];
      aLPivIdxs[nLPivs - j] = aLPivIdxs[nLPivs - (j + 1)];
    }
    aLPivLows[0] = candPrc;
    aLPivIdxs[0] = candIdx;
    nLPivs++;
  }
}
// -- Dump inventory of high pivots for debugging
/*
for (k=0; k<nHPivs; k++) {
_TRACE("High pivot no. " + k
+ " at barindex: " + aHPivIdxs[k] + ", "
+ WriteVal(ValueWhen(BarIndex()==aHPivIdxs[k],
DateTime(), 1), formatDateTime)
+ ", " + aHPivHighs[k]);
}
 */
// -- OK, let's plot the pivots using arrows
PlotShapes(IIf(aHPivs == 1, shapeDownArrow, shapeNone), colorRed, 0, High, Offset =  - 15);
PlotShapes(IIf(aLPivs == 1, shapeUpArrow, shapeNone), colorBrightGreen, 0, Low, Offset =  - 15);
4 comments
Leave Comment
Please login here to leave a comment.
I find that using 2 periods for the Heiken Ashi is almost exactly the same as the original, but 3 just looks neater :-)
Beautiful code.
I ran a step forward test in Ami.
Unfortunately the turning point arrows are future looking. As the code steps forward the turning point arrows appear , disappear and then reappear.
All is not lost though. There is sufficient information in the Heikin Ashi candle bodies to be able to call turning points
Thanks for a really good study.
Geo
This is the same as:
http://www.wisestocktrader.com/indicators/3197-heikin-ashi-koma-ashi-with-moving-average-type-2
except for the last line.
how do I put this indicator on ProRealTime?