Point & Figure Chart based on closing price v4.53 for Amibroker (AFL)
parfumeur over 16 years ago Amibroker (AFL)
Point & Figure charting.
Screenshots
Indicator / Formula
Copy & Paste Friendly
// P&F chart based on closing price
// Date & Bar Number of start & end of columns
// Graham Kavanagh 17 Apr 2004
// Interpretation window data included
// 1:1 Line drawn when column selected with slope=boxsize
// Box size based on ATR of closing price
Version(4.53);
SetBarsRequired(100000,100000);
range = Min(260,BarCount/2);
box = LastValue( round(ATR(range)*100)/100 );
Reverse = 3 ; // reversal requirement
CX = round(C/box);
CF = ceil(Cx);
CR = floor(Cx);
Bar = BarIndex();
BarDate = DateNum();
BarTurn = 0;
BarEnd = 0;
// initialize first element
j = 0;
PFC[j] = CF[0];
PFO[j] = CF[0]+1;
down = 1; // By default the first bar is a down bar.
up = 0;
// perform the loop that produces PF Chart
for( i = 1; i < BarCount; i++ )
{
if( CF[i] <= PFC[j]-1 && down) //continue down
{
PFC[j] = CF[i];
PFO[j] = CF[i]+1;
BarEnd[j] = Bar[i];
}
else
{
if( CR[i] >= PFC[j] + Reverse && down) //Change direction to up
{
j++;
up = 1;
down = 0;
PFC[j] = CR[i];
PFO[j] = CR[i] - 1;
BarTurn[j] = Bar[i];
BarEnd[j] = Bar[i];
}
}
if( CR[i] >= PFC[j] + 1 && up) //Continue up
{
PFC[j] = CR[i];
PFO[j] = CR[i] - 1;
BarEnd[j] = Bar[i];
}
else
{
if( CF[i] <= PFC[j] - Reverse && up) //Change direction to down
{
j++;
up = 0;
down = 1;
PFC[j] = CR[i];
PFO[j] = CR[i]+1;
BarTurn[j] = Bar[i];
BarEnd[j] = Bar[i];
}
}
}
delta = BarCount-1 - j;
BarTurns = Ref( BarTurn, -delta);
BarEnds = Ref( BarEnd, -delta);
PFO = Ref( PFO, -delta );
PFC = Ref( PFC, -delta );
H = IIf( Ref(PFC,-1)>Ref(PFO,-1), Ref(HHV(PFC,1),-1)-1, Max(PFO,PFC) )*box +
box/2;
L = IIf( Ref(PFC,-1)<Ref(PFO,-1), Ref(LLV(PFC,1),-1)+1, Min(PFO,PFC) )*box -
box/2;
O = IIf( Ref(PFC,-1)>Ref(PFO,-1), Ref(HHV(PFC,1),-1)-1, IIf(
Ref(PFc,-1)<Ref(PFO,-1), Ref(LLV(PFC,1),-1)+1, PFO ) )*box;
// the difference between Open AND Close is set to box size
// the sign decides if X or O are plotted
C = O + box * IIf( PFC > PFO, 1, -1 );
top = H - box/2;
bot = L + box/2;
GraphXSpace = 5;
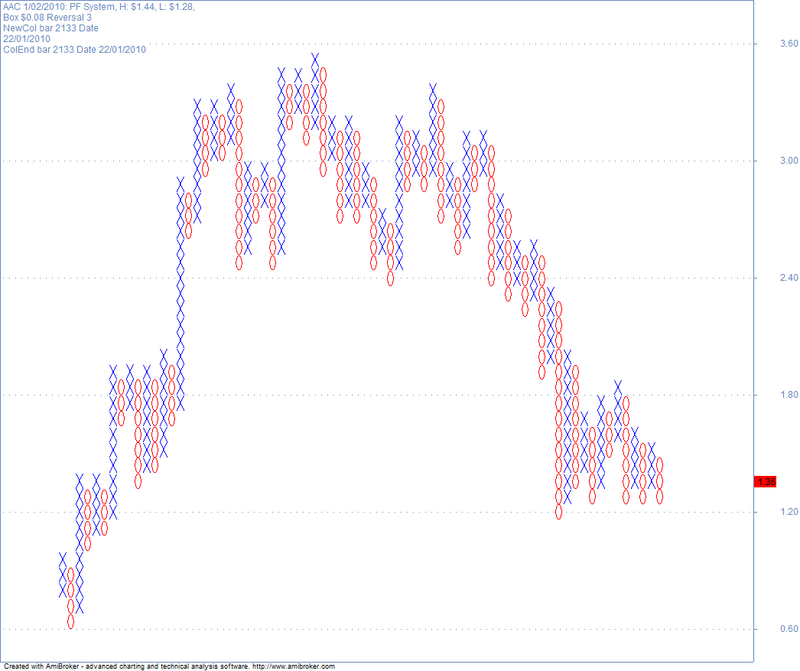
//Title = Name() + " " + Now(1) + ": PF System, H: $" + Top + (for today's date)
_N(
Title = Name() + " " + Date() + ": PF System, H: $" + Top + ", L: $" + Bot + ",
Box $" + Box + " Reversal " + Reverse + "\n" + "NewCol bar " + BarTurns + " date
" + WriteVal(
ValueWhen(BarIndex()==SelectedValue(BarTurns),DateTime()),formatDateTime) + "
ColEnd bar " + BarEnds + " date " + WriteVal(
ValueWhen(BarIndex()==SelectedValue(BarEnds),DateTime()),formatDateTime)
);
Plot(C, "P&F Close", IIf( PFC > PFO, colorBlue, colorRed ), styleCandle +
stylePointAndFigure);
LineUp = LineArray( SelectedValue(BarIndex()), SelectedValue(L),
SelectedValue(BarIndex())+1, SelectedValue(L)+box, 1, 0 );
Linedown = LineArray( SelectedValue(BarIndex()), SelectedValue(H),
SelectedValue(BarIndex())+1, SelectedValue(H)-box, 1, 0 );
Plot(IIf(SelectedValue(PFC<PFO),Lineup,Null), "Line", colorGreen, styleLine +
styleNoLabel + styleNoRescale);
Plot(IIf(SelectedValue(PFC>PFO),Linedown,Null), "Line", colorBrown, styleLine +
styleNoLabel + styleNoRescale);
//--Indicator-End--
Name() +", "+FullName();
"";
"Direction = " + WriteIf(pfc>pfo,"Up","Down");
"Move Today = " + WriteIf(BarIndex()==SelectedValue(BarEnds),"Yes" +
WriteIf(BarIndex()==SelectedValue(BarTurns),", New Column", ",
Continuation"),"No");
"";
"Column Start \n BarIndex() = " + BarTurns + "\n Date() = " + WriteVal(
ValueWhen(BarIndex()==SelectedValue(BarTurns), DateTime()), formatDateTime) ;
"Column End \n BarIndex() = " + BarEnds + "\n Date() = " + WriteVal(
ValueWhen(BarIndex()==SelectedValue(BarEnds),DateTime()),formatDateTime) ;
12 comments
Leave Comment
Please login here to leave a comment.
I really liked it, because it appears in the screenshot look real point figure.
regards,
chynthia
Why such a low rating? It’s a great formula.
The movetoday does not change from ‘No’ in the interpretation window on any bar ! Is there any error in the code or do I need to change any parameter. Can any one help? Thanks.
I tried using Amibroker’s replay feature for this formula and i can confirm that it works fine.
If you draw trend lines and put counts on the charts they are moving
and they are not stay in the right place, although of using the same parameters every time. IOn every change of column the code is moving the previous columns to the left;;
Can someone find the solution for that problem please; I am trying too…
I’m confused as to what you mean. Amibroker was not designed to do P&F, so adding trend lines by drawing them will not work, as P&F is not based on time. Amibroker charting is meant to display price movement over time. I think it’s a layer issue. However, I’m still confused at what you are trying to do. If you want true P&F, you will need a dedicated program like Bull’s Eye Broker from Archer Analysis. If you want to draw trend lines, you need to print the chart, then draw the lines by hand. Nuissance, but keeps you alert <vbg>.
As you now in Point & Figure you must draw trendlines, calculate and write counts and other information on the chart.
I do not see the reason for moving all the chart one click to the left every day…(so the trendlines and other information that you have drawn stay stand and appears the next day on wrong seat)
Iam sure that is a way to avoid that. The previous chart must stay stand and every day a new column must be creating to the right of it…
Thanks for the answer anyway!!
Is there anyway to start drawing the chart from one specific point ,so that every time o new column is created the previous columns stays stand…;;
too many errors (12)
@cadoize → The error occurred due to a newer version of Amibroker that now uses the word <reverse> as an internal command/code (or reserved word). Hence we just need to change the programmer’s selected word <reverse> which was not originally reserved to another unique word. I just added an ‘_’ to the end, creating <reverse_>, and ‘poof’ it works. Good luck.
Obviously you can choose ANY non reserved word, and change all instances of <reverse> to you new word.
please help to make it workable in newer version of amibroker .
Thanks in advance.
@bsedoha → Please be more specific about your problem. It works fine on my computer with the latest Amibroker v6.20.1 (32bit). I’ll repost in the ‘Pastie’ section, with green [X]’s.
The chart may be visually ‘flexible’, so stretch to suit on screen, depending on your screen, resolution and video card. Do adjust so it makes sense – nice round [O] and even [X]’s.
You can find the new version here