Stock Portfolio Organizer
The ultimate porfolio management solution.
WiseTrader Toolbox
#1 Selling Amibroker Plugin featuring:
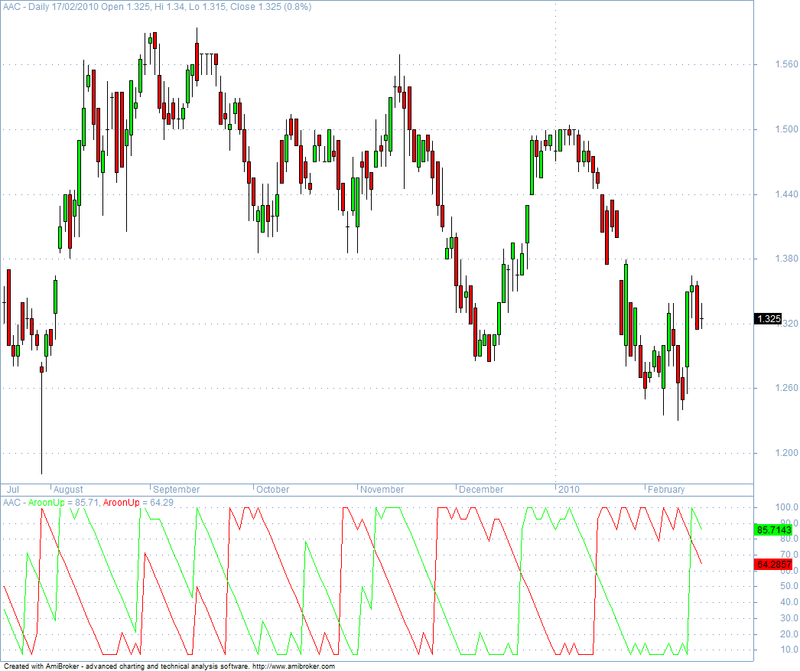
Aroon for Amibroker (AFL)
The Aroon indicator allows you to anticipate changes in security prices from trending to trading range. The indicator uses two lines: Aroon Up and Aroon Down. Aroon Down is a measure of how close the current bar is to the most recent lowest Low bar found in the last N bars. Aroon Up is a measure of how close the current bar is to the most recent highest High bar found in the last N bars. Additionally Aroon oscillator can be defined as the difference between the Aroon Up and Aroon Down indicators. For more information on the Aroon indicator see the article written by Tushar Chande in the September 1995 issue of Technical Analysis of Stocks & Commodities magazine.
Aroon indicator ranges from 0 to 100 and it is drawn with additional 30/70 levels. The default period is 14 days. The indicator works as follows: if a security makes a new 14-day high, the Aroon Up = 100; when the security makes a new 14-day low, the Aroon Down = 100; when there was no new high in 14 days, the Aroon Up = 0; and consequently when there was no new low for 14 days, the Aroon Down = 0.
Aroon indicator is an another way (in addition to VHF and ADX indicators) of detemining if market is trending or not.
Translated from the original metastock code
Screenshots
Similar Indicators / Formulas
Indicator / Formula
ard = 100* (14 - (( IIf(Ref(L,-1) == LLV(L, 14 ) ,1 , IIf( Ref(L ,-2 ) == LLV(L, 14 ) ,2 , IIf( Ref(L
,- 3 ) ==
LLV(L, 14 ) ,3 ,IIf( Ref(L ,-4 ) == LLV(L, 14 ) ,4 ,IIf(Ref( L ,-5 ) == LLV(L, 14 ) ,5 ,IIf(Ref(L ,-6 )
==
LLV(L, 14 ) ,6 ,IIf( Ref(L ,-7 ) == LLV(L, 14 ) ,7 ,IIf(Ref( L ,-8 ) == LLV(L, 14 ) ,8 ,IIf(Ref( L ,-9
) ==
LLV(L, 14 ) ,9 ,IIf( Ref(L,-10) == LLV(L,14 ) ,10 ,IIf(Ref(L ,-11) == LLV(L, 14 ) ,11
,IIf(Ref(L,-12 ) ==
LLV(L ,14) ,12,IIf( Ref(L,-13) == LLV(L ,14 ) ,13 ,IIf( Ref( L,-14) == LLV(L, 14 ) ,14
,0) ) ) ) ) ) ) ) ) ) ) ) ) ) ) ) ) / 14;

aru = 100 * ( 14 - ( ( IIf(Ref(H ,-1) == HHV(H, 14) ,1 ,IIf(Ref(H ,-2 ) == HHV(H, 14) ,2 ,IIf(Ref(H
,- 3 ) ==
HHV(H, 14) ,3, IIf(Ref(H ,-4 ) == HHV(H, 14) ,4 ,IIf(Ref(H ,-5 ) == HHV(H, 14) ,5 ,IIf(Ref(H ,-6 )
==
HHV(H, 14) ,6 ,IIf(Ref(H,-7 ) == HHV(H, 14) ,7 ,IIf(Ref(H ,-8 ) == HHV(H, 14) ,8 , IIf(Ref(H ,-9 )
==
HHV(H, 14) ,9 ,IIf(Ref(H ,-10 ) == HHV(H, 14) ,10 ,IIf(Ref(H ,-11 ) == HHV(H, 14) ,11 ,IIf(Ref(H
,-12 ) ==
HHV(H, 14) ,12 ,IIf(Ref(H ,-13) == HHV(H, 14) ,13 ,IIf(Ref(H ,-14 ) == HHV(H, 14) ,14 ,0 ) ) ) ) ) )
) ) ) ) ) ) ) ) ) ) ) / 14;

Plot( aru, "Aroon Up", colorRed);
Plot( ard, "Aroon Down", colorBlue);
1 comments
Leave Comment
Please login here to leave a comment.
Back
Sorry …. BUT:
As of Today the above code can be reduced to a far more readeable:
Regards