Stock Portfolio Organizer
The ultimate porfolio management solution.
Shares, Margin, CFD's, Futures and Forex
EOD and Realtime
Dividends and Trust Distributions
And Much More ....
WiseTrader Toolbox
#1 Selling Amibroker Plugin featuring:
Advanced Adaptive Indicators
Advanced Pattern Exploration
Neural Networks
And Much More ....
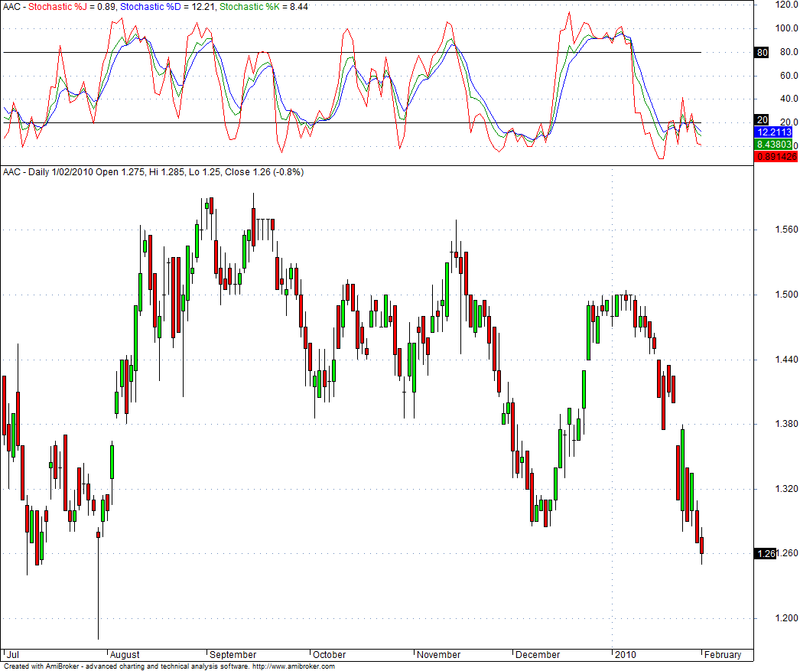
Stochastic %J - KDJ for Amibroker (AFL)
Rating:
2 / 5 (Votes 5)
Tags:
oscillator, amibroker, stochastic
The KDJ indicator is a form of the Stochastic. The difference is an extra line called the %J line. The %J line is the divergence of the %D value from the %K. The value of %J can go beyond 0 or 100 for %K and %D lines on the chart.
Trading Signals: A negative value of %J with %K and %D at the bottom range indicates a strong over sold condition. When the %J value goes above 100, with %K and %D at the top range, indicates a strong over bought condition.
Settings: Default: 14 period, 3 period, 1 period
By Barry Scarborough – razzbarry [at] imageview.us
Screenshots
Similar Indicators / Formulas
ATR & Volume Adjusted Momentum
Submitted
by Gorilabd almost 16 years ago
Debu Market Efficiency Ratio
Submitted
by agent301 almost 14 years ago
MACD (new timing)
Submitted
by tigernifty almost 14 years ago
Dynamic Positioning Indicator (DPI)
Submitted
by kelvinhand almost 13 years ago
KILL THE OPERATOR MACD
Submitted
by prasadmuni almost 14 years ago
3 Days Track
Submitted
by janet0211 about 16 years ago
Indicator / Formula
Copy & Paste Friendly
_SECTION_BEGIN("Stochastic %J");
printf("The KDJ indicator is actually a derived form of the Stochastic with the
only difference being an extra line called the J line." +
" The J line represents the divergence of the %D value from the %K. The value
of J can go beyond [0, 100] for %K and %D lines on the chart." +
"\nTrading Signals: A negative value of J combined with %K and %D at the bottom
range indicates a strong over sold signal." +
" Likewise, when the J value goes above 100, combined with %K and %D at the top
range, it will indicate a strong over bought signal. " +
"\nSettings: Default:  14 period, 3 period, 1 period");


N 	= param("Range", 9, 2, 20, 1);
M1 	= param("%K Period", 3, 1, 20, 1);
M2	= param("%D Period", 3, 1, 20, 1);

RSV	= (CLOSE - LLV(LOW, N))/(HHV(HIGH, N)- LLV(LOW, N)) * 100;
K 	= EMA(RSV, M1);
D 	= EMA(K, M2);
J 	= 3 * K-2 * D;
plot(J, "Stochastic %J", colorred);
plot(D, "Stochastic %D", colorblue);
plot(K, "Stochastic %K", colorgreen);
plot(80, "", colorblack);
plot(20, "", colorblack);
_SECTION_END();
1 comments
Leave Comment
Please login here to leave a comment.
Back
It doesn’t work. Fix it please!