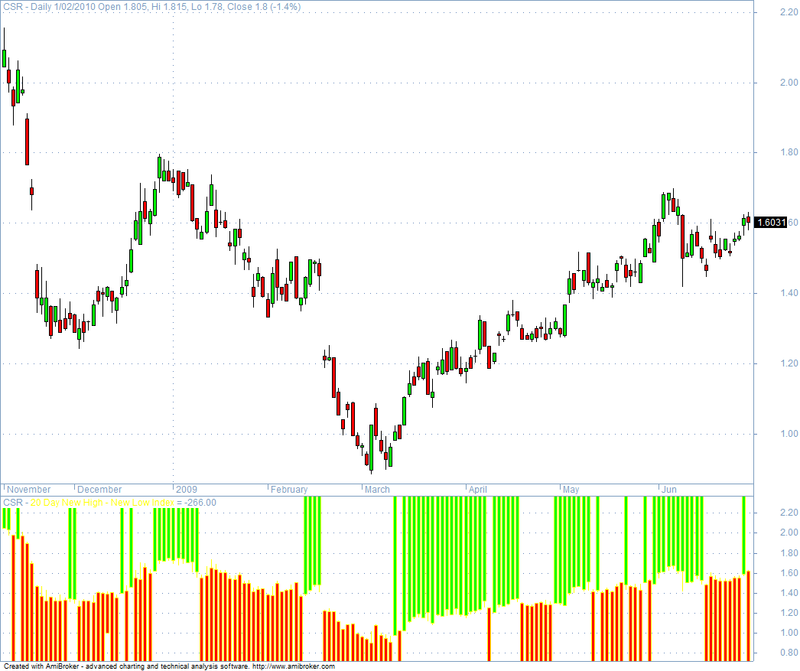
20 Day High's vs new 20 Day lows for Amibroker (AFL)
indranil999 over 16 years ago Amibroker (AFL)
20 Day High’s vs new 20 Day lows. To make this work you need to run a scan in Amibroker first.
Screenshots
Indicator / Formula
Copy & Paste Friendly
// Calculates new 20 Day High's vs new 20 Day lows.
// The new symbol "~NewHiNewLoIndex" will be found in the Workspace > Symbol >
//All > at the end.
// Input a Date 5 years back to the current Date in the Range section of the
//Analysis Window AND click the From button.
// In the Apply To section, click the Use Filter button AND click the Define >
//Include > Group > Stock ;
// to scan stocks ONLY. Right click on chart window, then > Parameters > Show
//MiddlLe Lines - NO > Levels > +-100.
// Compare against the SP-500, look for convergences, divergences. Read Elder's
//book "Trading For A Living" pp.194-200.

H1 = High > Ref(HHV(High,10),-1);
L1 = Low < Ref(LLV(Low,10),-1);
HiLoDifference = H1 - L1;

Buy = 0;
Filter = 0;

AddToComposite( HiLoDifference , "~20HiNewLoIndex", "c", atcFlagDefaults =7);
GraphXSpace = 10;
Plot(Foreign("~20HiNewLoIndex","C",1),"20 Day New High - New Low Index",colorYellow,styleCandle);
1 comments
Leave Comment
Please login here to leave a comment.
error 55
ln: 21 col: 75