Stock Portfolio Organizer
The ultimate porfolio management solution.
Shares, Margin, CFD's, Futures and Forex
EOD and Realtime
Dividends and Trust Distributions
And Much More ....
WiseTrader Toolbox
#1 Selling Amibroker Plugin featuring:
Advanced Adaptive Indicators
Advanced Pattern Exploration
Neural Networks
And Much More ....
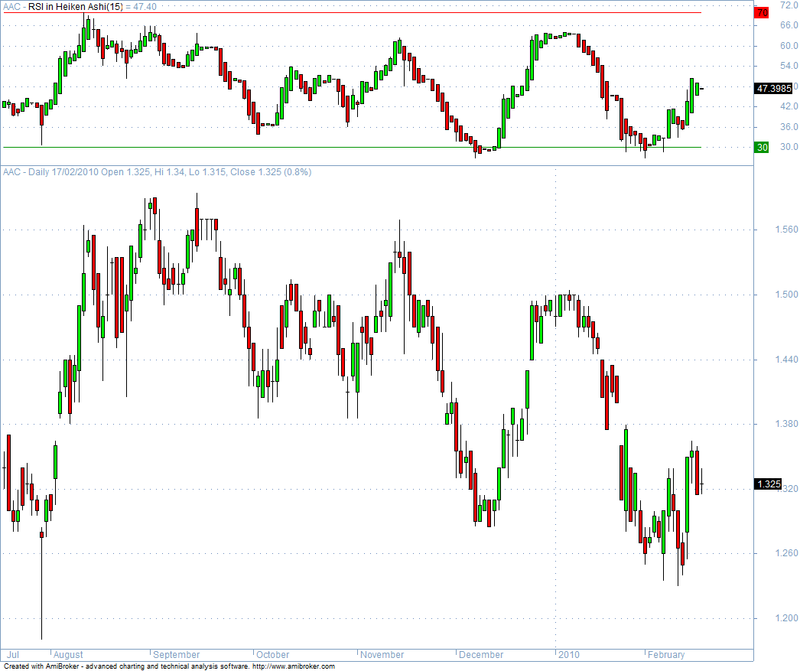
RSI in Heiken Ashi for Amibroker (AFL)
Rating:
4 / 5 (Votes 7)
Tags:
oscillator, amibroker
It shows the RSI of Heikin-Ahshi candles with respect to overbought/oversold levels.
Screenshots
Similar Indicators / Formulas
Debu Market Efficiency Ratio
Submitted
by agent301 almost 14 years ago
MACD (new timing)
Submitted
by tigernifty almost 14 years ago
3 Days Track
Submitted
by janet0211 about 16 years ago
KILL THE OPERATOR MACD
Submitted
by prasadmuni almost 14 years ago
DMI Spread
Submitted
by pipstar about 16 years ago
Indicator / Formula
Copy & Paste Friendly
_SECTION_BEGIN("RSI in Heiken Ashi");

periods = Param( "Periods", 15, 1, 200, 1 );

HaClose = (RSIa(Open, periods)+RSIa(High, periods)+RSIa(Low,periods)+RSIa(Close,periods))/4;

HaOpen = AMA( Ref( HaClose, -1 ), 0.5 );

HaHigh = Max( RSIa(High, periods), Max( HaClose, HaOpen ) );

HaLow = Min( RSIa(Low,periods), Min( HaClose, HaOpen ) );

PlotOHLC( HaOpen, HaHigh, HaLow, HaClose, _DEFAULT_NAME(), colorBlack, styleCandle );

Plot(70,"",colorRed,styleLine);

Plot(30,"",colorGreen,styleLine);

_SECTION_END();
3 comments
Leave Comment
Please login here to leave a comment.
Back
Hi and thanks a lot for this RSI.
It is indeed very efficient to determine tops, bottoms and pivots.
Cheers.
nice formula. helpful indeed. thanx dude
hi,this indi looks great,can anyone atach the .ex file ,I don’t know how to program an indicator,thanks in advance!