T3 Panorama Price Chart for Amibroker (AFL)
mrugen over 16 years ago Amibroker (AFL)
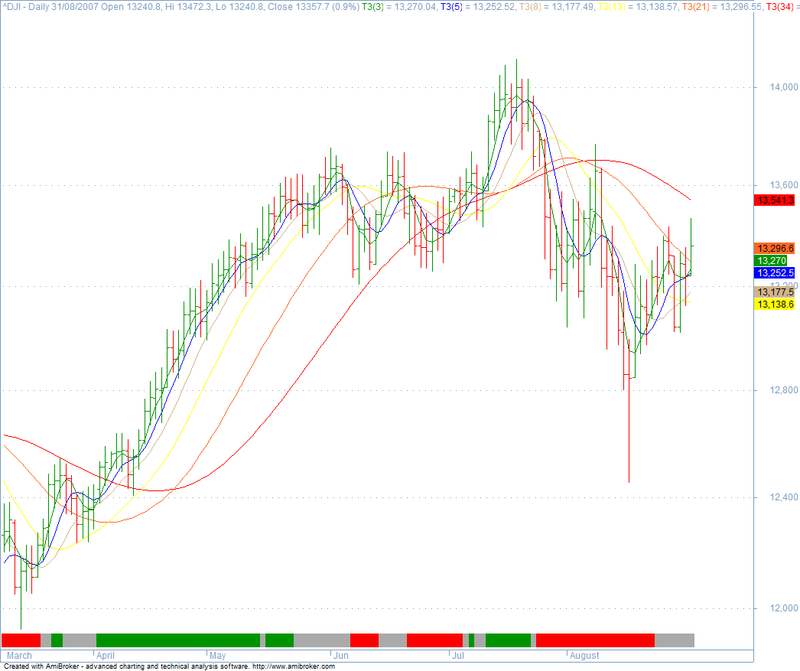
Price chart that uses T3 for smoothing moving averages and generates buy and sell signals using other indicators.
Screenshots
Indicator / Formula
Copy & Paste Friendly
_SECTION_BEGIN("Price");
SetChartOptions(0,chartShowDates|chartShowArrows|chartLogarithmic|chartWrapTitle);
_N(Title = StrFormat("{{NAME}} - {{INTERVAL}} {{DATE}} Open %g, Hi %g, Lo %g, Close %g (%.1f%%) {{VALUES}}", O, H, L, C, SelectedValue( ROC( C, 1 ) )));


function T3(price,periods) //AMA-based
{
s = 0.618;
periods = 2/(periods+1);
e1=AMA(price,periods);
e2=AMA(e1,Periods);
e3=AMA(e2,Periods);
e4=AMA(e3,Periods);
e5=AMA(e4,Periods);
e6=AMA(e5,Periods);
c1=-s*s*s;
c2=3*s*s+3*s*s*s;
c3=-6*s*s-3*s-3*s*s*s;
c4=1+3*s+s*s*s+3*s*s;
Ti3=c1*e6+c2*e5+c3*e4+c4*e3;
return ti3;
}
Plot( C, "", IIf(Close > Open, colorGreen, colorRed), styleBar + styleNoLabel);
_SECTION_END();

_SECTION_BEGIN("trending ribbon");
uptrend=PDI()>MDI()AND Signal()<MACD();
downtrend=MDI()>PDI()AND Signal()>MACD();
Plot( 2, "",IIf( uptrend, colorGreen, IIf( downtrend, colorRed, 0 )), styleOwnScale|styleArea|styleNoLabel, -0.5, 100 );
_SECTION_END();


//#include <T3.AFL>;
Plot(T3(C,3),"T3(3)",colorGreen,1);
Plot(T3(C,5),"T3(5)",colorBlue,1);
Plot(T3(C,8),"T3(8)",colorTan,1);
Plot(T3(C,13),"T3(13)",colorYellow,1);
Plot(T3(C,21),"T3(21)",colorOrange,1);
Plot(T3(C,34),"T3(34)",colorRed,1);
0 comments
Leave Comment
Please login here to leave a comment.