350 Swing Indicator for Amibroker (AFL)
elmoro94 over 16 years ago Amibroker (AFL)
Barbara Stars article in Stocks & Commodities February issue, The 350 Swing Trade, outlines several trading systems based on J. Welles Wilders relative strength index (Rsi).
The swing 350 system is based on the three-bar Rsi. Star suggests combining the smoothed Rsi with any of the following: a trend-establishing moving average; Wilders average directional movement indicator (Adx); or Bollinger bands. Strategy code for some of these combination’s also presented here.
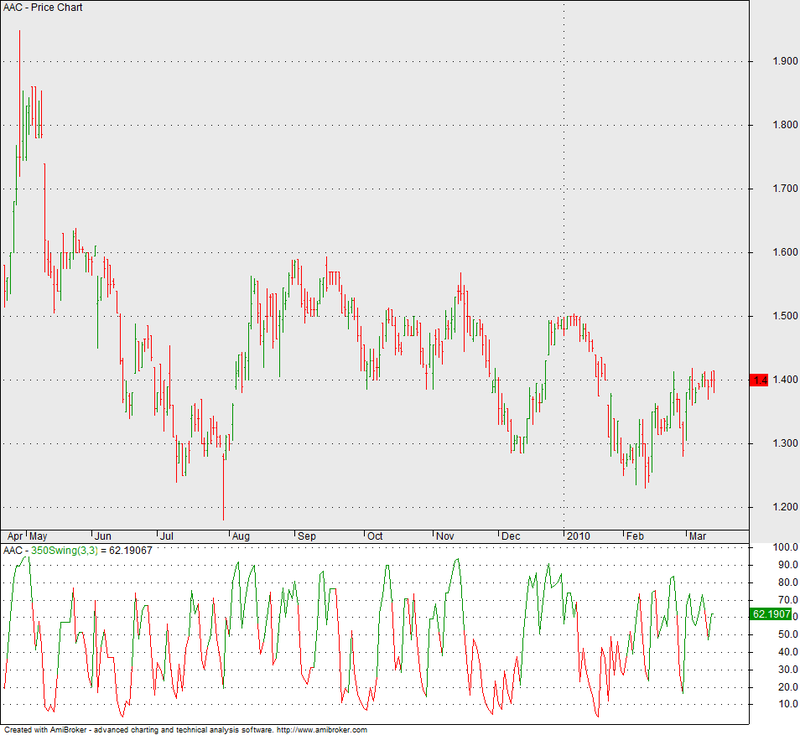
The chart below demonstrates three display modes for Barbara Stars 350 swing indicator: a color-coded candlestick chart of (PODD) with a 20-day Donchian channel (upper pane); a three-day moving average of a three-day RSI (middle pane); and a color-coded three-day RSI (bottom pane).
Screenshots
Indicator / Formula
// 350 Swing Indicator
_SECTION_BEGIN("350Swing");

nRSILen = Param("RSI Length", 3, 2, 50 );
nMALen = Param("MA Length", 3 );
UpColor = ParamColor("UpColor", colorGreen );
DnColor = ParamColor("DnColor", colorRed );

r = RSI( nRSILen );
rma = MA( r, nMALen );
Color = IIf( r > 50, UpColor, DnColor );

mode =  ParamList("Display", "RSI|RSIMA|Price");

switch( mode )
{
case "RSI":
         Plot( r, _DEFAULT_NAME(), Color );
         break;
case "RSIMA":
         Plot( rma,  "RSI MA" + _PARAM_VALUES(), colorBlue );
         PlotOHLC( 50, rma, 50, rma, "", colorLightBlue , styleCloud | styleClipMinMax, 20, 80 );
         break;
case "Price":
         SetBarFillColor( Color );
         Plot( C, "Price", Color, styleCandle );
         PlotShapes( ( rma < 20 ) * shapeSmallCircle, colorGreen, 0, L, -20 );
         PlotShapes( ( rma > 80 ) * shapeSmallCircle, colorRed, 0, H, 20 );
         Plot( HHV( H, 20 ), "", colorLightBlue );
         Plot( LLV( L, 20 ), "", colorLightBlue );
         break;
}
_SECTION_END();
0 comments
Leave Comment
Please login here to leave a comment.