Polarized Fractal Efficiency for Amibroker (AFL)
kaiji over 16 years ago Amibroker (AFL)
The January 1994 issue of Stocks & Commodities featured an article by Hans Hannula on Polarized Fractal Efficiency. Here is the custom formula for creating the five-period smoothed 10-Day PFE.
Interpretation
Drawing upon the pioneering works of mathematician Benoit Mendelbrot, Mr. Hannula developed an indicator to gauge the efficiency that prices travel between two points in time.
The more linear and efficient price movement, the shorter the distance the prices must travel between two points. The more “squiggly” the price movement, the less efficient it’s travel.
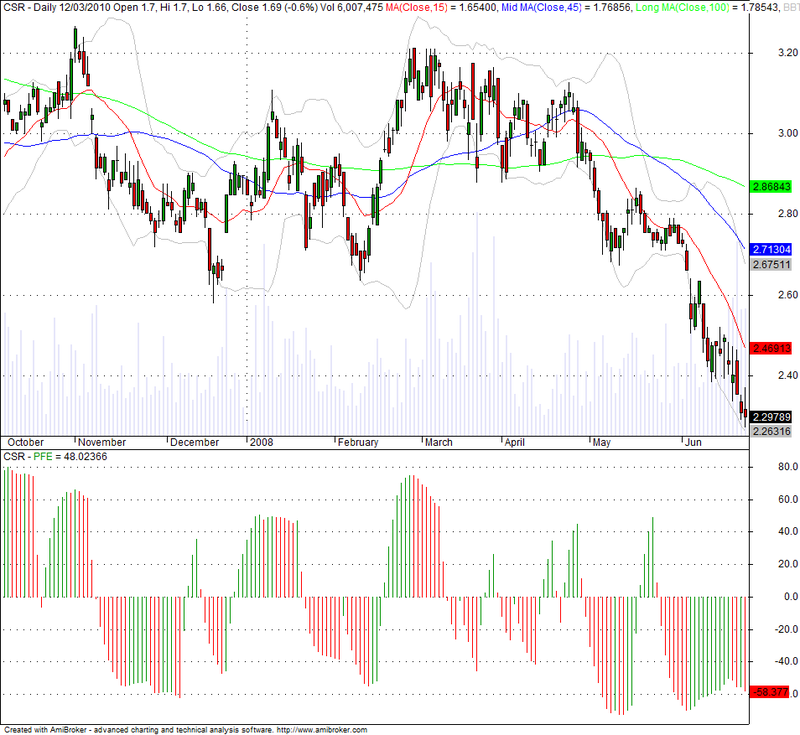
The primary use of the PFE indicator is as a measure of how trendy or congested price action is. PFE readings above zero mean that the trend is up. The higher the reading the “trendier” and more efficient the upward movement. PFE readings below zero mean that the trend is down. The lower the reading the “trendier” and more efficient the downward movement. Readings around zero indicate choppy, less efficient movement, with a balance between the forces of supply and demand.
Several interesting phenomenon have been observed by Mr. Hannula:
Indexes (particularly the OEX) tend to have a maximum PFE (both plus and minus) of about 43%.
The middle region (around zero) is a balance between supply and demand and therefore a congestion point.
A hooking pattern often occurs right before the end of an efficient period. This pattern occurs when the PFE appears to have maxed out, turns in the opposite direction towards zero, and then makes one last attempt at maximum efficiency. Trades can be entered in the opposite direction, with a stop just beyond the extreme of the hook. Stay with the trade all the way to the other extreme, unless it slows around the zero line. If it slows around zero, exit the trade and wait for a new maximum efficiency entry.
Screenshots
Indicator / Formula
/*Polarized Fractal Efficiency

The January 1994 issue of Stocks & Commodities featured an article by Hans Hannula on Polarized Fractal Efficiency. Here is the custom formula for creating the five-period smoothed 10-Day PFE using AmiBroker:*/

pds=10;
x=sqrt((ROC(C,9)*ROC(C,9))+100);
y=Sum(sqrt((ROC(C,1)* ROC(C,1))+1),pds);
z=(x/y);
pfe=EMA(IIf(C>Ref(C,-9),z,-z)*100,5);

Plot(pfe,"PFE",IIf(pfe>Ref(pfe,-1),colorGreen,colorRed),styleHistogram);

"PFE" +WriteIf(pfe>10, " Indicates an upward Trend",WriteIf(pfe>-10 AND pfe<10, "  Indicates a Consolidation Phase is in place", " Indicates a downward Trend "))+WriteIf(pfe>Ref(pfe,-1),"\n The Indicator is currently Rising which indicates a strengthening Up Trend or weakening Down Trend", "\n The indicator is currently falling which indicates a weakening uptrend or a trengthening Down Trend");
0 comments
Leave Comment
Please login here to leave a comment.