ZeroLag RSI (colored) for Amibroker (AFL)
solwake about 16 years ago Amibroker (AFL)
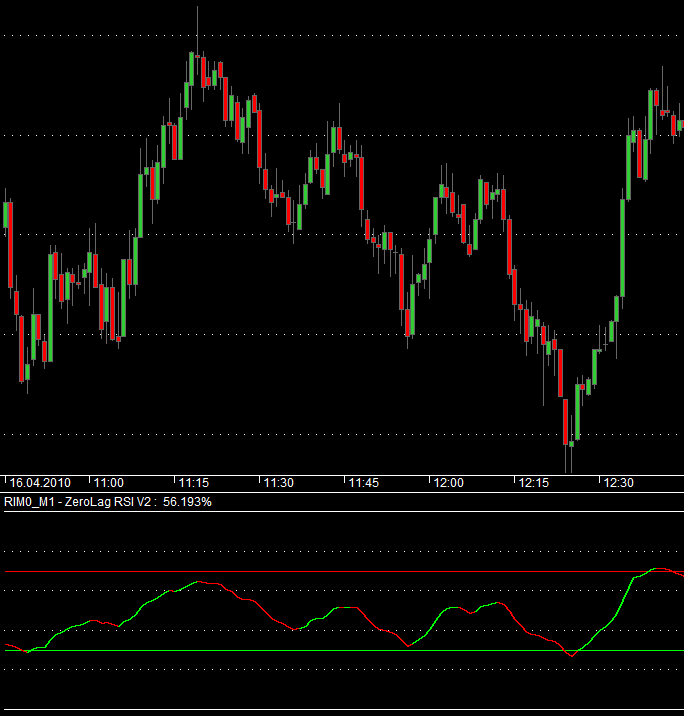
Colored ZeroLag RSI
The Relative Strength Index (RSI) is a trading indicator in the technical analysis of financial markets. It is intended to indicate the current and historical strength or weakness of a market based on the closing prices of completed trading periods. It assumes that prices close higher in strong market periods, and lower in weaker periods and computes this as a ratio of the number of incrementally higher closes to the incrementally lower closes.
Interpretation
Wilder posited that when price moves up very rapidly, at some point it is considered overbought. Likewise, when price falls very rapidly, at some point it is considered oversold. In either case, Wilder felt a reaction or reversal is imminent. The slope of the RSI is directly proportional to the velocity of the move. The distance traveled by the RSI is proportional to the magnitude of the move.
As a result, Wilder believed that tops and bottoms are indicated when RSI goes above 70 or drops below 30. Traditionally, RSI readings greater than the 70 level are considered to be in overbought territory, and RSI readings lower than the 30 level are considered to be in oversold territory. In between the 30 and 70 level is considered neutral.
Wilder further believed that divergence between RSI and price action is a very strong indication that a market turning point is imminent. Bearish divergence occurs when price makes a new high but the RSI makes a lower high, thus failing to confirm. Bullish divergence occurs when price makes a new low but RSI makes a higher low.
Screenshots
Indicator / Formula
/*ZeroLag RSI */
/*Code adapted from ZeroLag Williams %R Indicator */
/* Additional params added for change of RSI periods and EMA1&2 */

GraphXSpace = 3;

RSIPeriod=Param("RSI Period Length", 14, 3 , 50, 1);
R = RSI(RSIperiod);

MaxGraph=10;
Period1=Param("Period 1", 10, 5, 50, 1);
Period2=Param("Period 2", 10, 5, 50, 1);
EMA1= EMA(R,Period1);
EMA2= EMA(EMA1,Period2);
Difference= EMA1 - EMA2;
ZeroLagEMA= EMA1 + Difference;
PR=abs(ZeroLagEMA);

Graph0=PR;

MoveAvg=MA(PR,5);

// Graph1=MoveAvg;          Remove the // if you want a Crossover MA to plot
// Graph1Color=colorTan;

Graph0Style=4;
upbar= PR>= MoveAvg AND PR>= Ref(PR,-1) ;
downbar=(PR < MoveAvg) OR PR>= MoveAvg AND PR< Ref(PR,-1) ;
barcolor = IIf( downbar,colorRed, IIf( upbar, colorBrightGreen, 7));
Graph0BarColor = ValueWhen( barcolor != 0, barcolor );
Graph2=30;
Graph3=70;

Graph2Style=Graph3Style=Graph4Style=1;
Graph4Color=2;
Graph2Color=5;
Graph3Color=4;

Graph5=0;
Graph6=100;
Graph5Style=Graph6Style=1;
Graph5Color=Graph6Color=2;

Title=Name()+" - ZeroLag RSI V2 :"+WriteVal(PR)+"%";
1 comments
Leave Comment
Please login here to leave a comment.