ZeroLag W%R for Amibroker (AFL)
solwake about 16 years ago Amibroker (AFL)
Williams %R, or just %R, is a technical analysis oscillator showing the current closing price in relation to the high and low of the past N days (for a given N). It was developed by a publisher and promoter of trading materials, Larry Williams. Its purpose is to tell whether a stock or commodity market is trading near the high or the low, or somewhere in between, of its recent trading range.The oscillator is on a negative scale, from -100 (lowest) up to 0 (highest), considered unusual since it is the obverse of the more common 0 to 100 scale found in many Technical Analysis oscillators. Although sometimes altered (by simply adding 100), this scale needn’t cause any confusion. A value of -100 is the close today at the lowest low of the past N days, and 0 is a close today at the highest high of the past N days.
Williams used a 10 trading day period and considered values below -80 as oversold and above -20 as overbought. But they were not to be traded directly, instead his rule to buy an oversold was
- R reaches -100.
- Five trading days pass since -100% was last reached
- R rises above -95 or -85%.
or conversely to sell an overbought condition
- R reaches 0.
- Five trading days pass since 0% was last reached
- R falls below -5 or -15%.
The timeframe can be changed for either more sensitive or smoother results. The more sensitive you make it, though, the more false signals you will get. The “close-position within a range” in the %R indicator is the same as the %K stochastic oscillator, on a different scale.
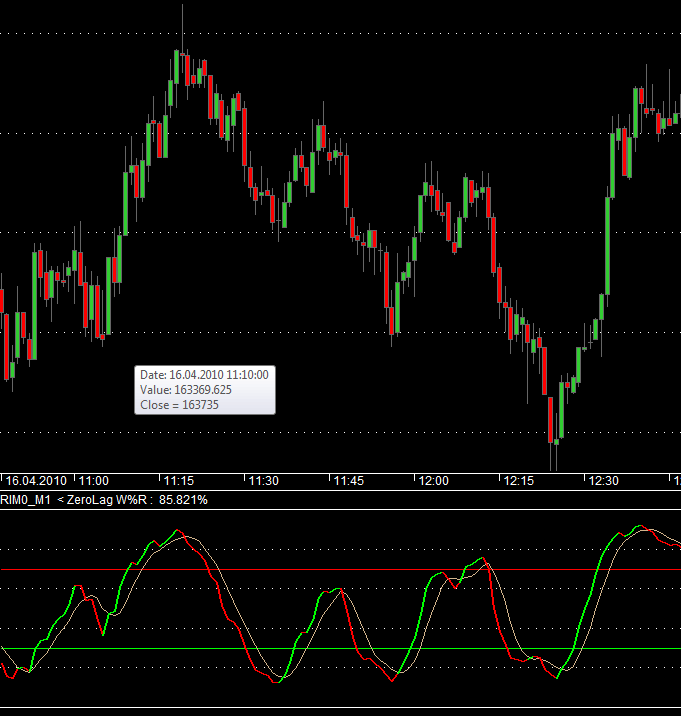
Screenshots
Indicator / Formula
period1 = Param( "Period 1", 10, 2, 200, 1 );
period2 = Param( "Period 2", 5, 2, 200, 1 );

/*ZeroLag W%R*/
"========";

GraphXSpace = 3;

R = ((HHV(H,14) - C) /(HHV (H,14) -LLV (L,14))) *-100;

MaxGraph=10;
//Period= 10;
EMA1= EMA(R,period1);
EMA2= EMA(EMA1,period2);
Difference= EMA1 - EMA2;
ZeroLagEMA= EMA1 + Difference;
PR=100-abs(ZeroLagEMA);

Graph0=PR;

MoveAvg=MA(PR,5);


Graph1=MoveAvg;

Graph1Color=colorTan;
Graph0Style=4;
upbar= PR>= MoveAvg AND PR>= Ref(PR,-1) ;
downbar=(PR < MoveAvg) OR PR>= MoveAvg AND PR< Ref(PR,-1) ;
barcolor = IIf( downbar,colorRed, IIf( upbar, colorBrightGreen, 7));
Graph0BarColor = ValueWhen( barcolor != 0, barcolor );
Graph2=30;
Graph3=70;

Graph2Style=Graph3Style=Graph4Style=1;
Graph4Color=2;
Graph2Color=5;
Graph3Color=4;

Graph5=0;
Graph6=100;
Graph5Style=Graph6Style=1;
Graph5Color=Graph6Color=2;

Title=Name()+"  < ZeroLag W%R :"+WriteVal(PR)+"%";
5 comments
Leave Comment
Please login here to leave a comment.
This is a very good momentum indicator. You can use it for intraday trading.
out of so many that i have come across this is the most responsive and rare to find
Line 17: PR=100-abs(ZeroLagEMA)
Caused the actual William’s % Range ( as seen in MT4 ) to break.
I tweaked it ( after lots of review on the WPR period of 55 with EMA13 ) & got the original MT4 type WPR back to life in Amibroker ( the color is an added advantage to the indicator )
My Code:
Good Trading Strategy based on WPR here
http://www.forextraders.com/forex-indicators/metatrader-williams-percent-range-settings.html
The above code is in sync with this strategy.
Thanks solwake, looks interesting to determine trend changes early.