Anchored Momentum with Exponential Smoothing for Amibroker (AFL)
Karlitos about 16 years ago Amibroker (AFL)
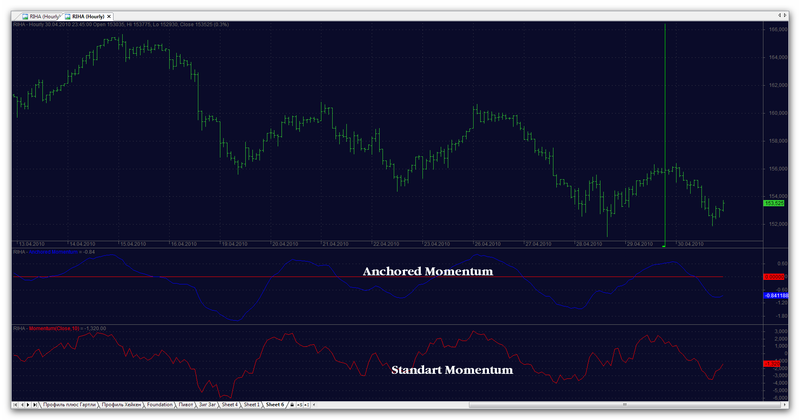
Momentum measures the rate of the rise or fall in stock prices. From the standpoint of trending, momentum is a very useful indicator of strength or weakness in the issue’s price. History has shown us that momentum is far more useful during rising markets than during falling markets; the fact that markets rise more often than they fall is the reason for this. In other words, bull markets tend to last longer than bear markets.
Screenshots
Indicator / Formula
Copy & Paste Friendly
Mode = ParamToggle("Smoothing", "On|Off" );
MomPer = Param("Momentum Periods", 10, 1, 100, 1);
SmaPer = Param("Moving Average Periods", 7, 1, 1000, 1);
EmaPer = Param("Exponential Moving Average Periods", 7, 1, 1000, 1);
BaseLine = 0;

if( Mode == 1)
{
Mom = 100 * ((Close / MA(Close, (2 * MomPer) + 1) ) - 1);
}
else
{
Mom = 100 * ((EMA(Close, EmaPer) / MA(Close, (2 * MomPer) + 1) ) - 1);
}

Plot( Mom, "Anchored Momentum", ParamColor( "Color", colorBlue ), 1 );
Plot( BaseLine, "BaseLine", colorRed, styleNoTitle, 1 );
0 comments
Leave Comment
Please login here to leave a comment.